Category: Kubernetes

  • This guide showcases how to start with a basic HTTP server and progressively incorporate TCP, static file serving, and middleware for logging. This helps showcase the depth of Go’s libraries and its application in real-world scenarios and versatility.

    Setting Up Your Go Environment

    Ensure Go is installed on your system by downloading it from the official website and verify the installation with go version.

    Writing Your First Web Server in Go

    Start with a simple HTTP server that responds with “Hello, World!” for every request.

    main.go

    package main
    
    import (
        "fmt"
        "net/http"
    )
    
    func handler(w http.ResponseWriter, r *http.Request) {
        fmt.Fprintf(w, "Hello, World!")
    }
    
    func main() {
        http.HandleFunc("/", handler)
        fmt.Println("Starting server at port 8080")
        log.Fatal(http.ListenAndServe(":8080", nil))
    }
    

    Run your server with go run main.go, and visit http://localhost:8080 to see your “Hello, World!” message.

    Networking with Go: TCP Server and Client

    You can extend your Go web server to include L4 capabilities, building a simple TCP server and client.

    TCP Server Example:

    package main
    
    import (
        "bufio"
        "fmt"
        "net"
    )
    
    func handleConnection(conn net.Conn) {
        defer conn.Close()
        reader := bufio.NewReader(conn)
        line, err := reader.ReadString('\n')
        if err != nil {
            fmt.Println("Error reading:", err)
            return
        }
        fmt.Printf("Received: %s", line)
        fmt.Fprintf(conn, "Echo: %s", line)
    }
    
    func main() {
        listener, err := net.Listen("tcp", ":8081")
        if err != nil {
            panic(err)
        }
        defer listener.Close()
        fmt.Println("TCP Server listening on port 8081")
        for {
            conn, err := listener.Accept()
            if err != nil {
                fmt.Println("Error accepting:", err)
                continue
            }
            go handleConnection(conn)
        }
    }
    

    TCP Client Example:

    Connects to the TCP server, sends a message, and receives an echo response.

    package main
    
    import (
        "bufio"
        "fmt"
        "net"
        "os"
    )
    
    func main() {
        conn, err := net.Dial("tcp", "localhost:8081")
        if err != nil {
            panic(err)
        }
        defer conn.Close()
        fmt.Println("Type your message:")
        reader := bufio.NewReader(os.Stdin)
        text, _ := reader.ReadString('\n')
        fmt.Fprintf(conn, text)
        message, _ := bufio.NewReader(conn).ReadString('\n')
        fmt.Print("Server echo: " + message)
    }
    

    Advanced Web Server: Handling Routes, Serving Static Files, and Logging Middleware

    Expand the web server to handle multiple / different routes, serve static files, and log requests with middleware.

    Enhanced Web Server:

    package main
    
    import (
        "fmt"
        "log"
        "net/http"
        "time"
    )
    
    func main() {
        http.HandleFunc("/", homeHandler)
        http.HandleFunc("/about", aboutHandler)
        http.Handle("/static/", http.StripPrefix("/static/", http.FileServer(http.Dir("static"))))
        http.Handle("/log/", loggingMiddleware(http.HandlerFunc(logHandler)))
    
        fmt.Println("Enhanced server running on port 8080")
        log.Fatal(http.ListenAndServe(":8080", nil))
    }
    
    func homeHandler(w http.ResponseWriter, r *http.Request) {
        fmt.Fprintln(w, "Welcome to the Home Page!")
    }
    
    func aboutHandler(w http.ResponseWriter, r *http.Request) {
        fmt.Fprintln(w, "About Page.")
    }
    
    func logHandler(w http.ResponseWriter, r *http.Request) {
        fmt.Fprintln(w, "This request was logged.")
    }
    
    func loggingMiddleware(next http.Handler) http.Handler {
        return http.HandlerFunc(func(w http.ResponseWriter, r *http.Request) {
            start := time.Now()
            defer log.Printf("%s %s %v", r.Method, r.URL.Path, time.Since(start))
            next.ServeHTTP(w, r)
        })
    }
    

    This guide covered the (very) basics of web and network programming in Go, starting from a simple web server to incorporating advanced features like L4 networking, static file serving, and middleware for logging. Go’s straightforward syntax and its powerful libraries, makes it an excellent choice for developers looking to build efficient, scalable web / network applications. Whether you’re new to Go or looking to expand your skills, this guide should hopefully provide a solid foundation for developing robust Go applications that can handle web and network tasks.
  • Kubernetes is the favored option for developing cloud-native / containerized applications due to its scalability, portability, and availability. Additionally, it offers other benefits, including:

    • Automated Deployment and Scaling: Kubernetes provides the capability to automatically deploy and scale applications in response to demand.
    • Self-healing: Kubernetes has the ability to self-heal, ensuring your applications / services remain continuously available.
    • Load Balancing: Kubernetes distributes traffic among multiple containers, preventing any single container from becoming overloaded.
    • Storage Orchestration: Kubernetes manages persistent data by automatically mounting storage volumes to containers, simplifying data management.
    • Security: Kubernetes offers a range of security features, including Role-Based Access Control and network policies.
    • Multi-Cloud Support: Kubernetes is an ideal choice for organizations aiming for cloud-agnostic solutions, providing compatibility across different cloud environments.

    Understand the Tooling

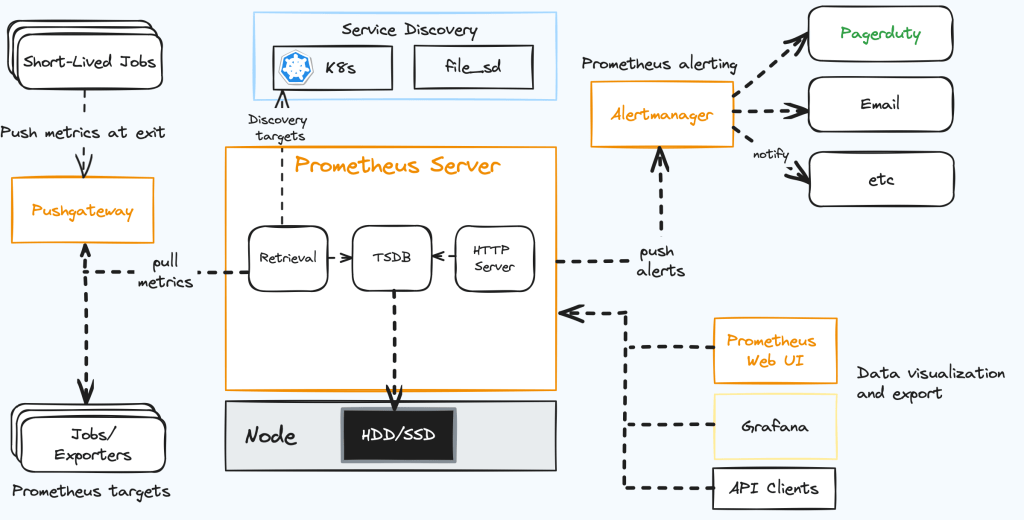
    Prometheus is an open-source monitoring system (originally developed by SoundCloud), which is widely adopted for monitoring cloud-native applications due to its scalability, reliability, and user-friendliness.

    Prometheus gathers metrics from multiple sources, including applications, services, and infrastructure components, and stores them in a time series database. This allows Prometheus to maintain a record of system performance.

    Prometheus utilizes software programs known as exporters. These exporters collect metrics from various sources and provide them to Prometheus. When new exporter are detected, Prometheus initiates the collection of metrics from that source, storing them in its database. Further configuration options enable Prometheus to scrape metrics from specific endpoints.

    • Scalability: Prometheus is crafted for scalability, making it suitable for monitoring multiple systems.
    • Reliability: Prometheus is recognized for its reliability.
    • User-Friendliness: Prometheus is known for its ease of use and straightforward configuration.
    • Open Source: Being an open-source project, Prometheus is freely available for use and can be modified to meet specific requirements.

    Prerequisites

    You will need an Azure account, the Azure CLI, Kubectl and Helm.

    You can install the latest versions of Kubectl and Helm using the Azure CLI or install them manually.

    Install the CLI tools on your local machine since you will need to forward a local port to access both the Prometheus and Grafana web interfaces.

    Create an Azure Kubernetes Service (AKS) Cluster

    Sign into the Azure CLI by running the login command.

    az login

    Install or update kubectl.

    az aks install-cli

    Create two bash variables which we will use in subsequent commands. (You may need to change the syntax below if you are using another shell.)

    RESOURCE_GROUP=aks-prometheus
    AKS_NAME=aks1

    Create a resource group. I have chosen to create this in the eastus2 Azure region.

    az group create --name $RESOURCE_GROUP --location eastus2

    Create a new AKS cluster using the az aks create command. Here we create a 3-node cluster using the B-series Burstable VM type which is cost-effective and suitable for this test.

    az aks create --resource-group $RESOURCE_GROUP \
      --name $AKS_NAME \
      --node-count 3 \
      --node-vm-size Standard_B2s \
      --generate-ssh-keys

    Authenticate to the cluster we have just created.

    az aks get-credentials \
      --resource-group $RESOURCE_GROUP \
      --name $AKS_NAME

    We can now access our Kubernetes cluster with kubectl. Use kubectl to see the nodes we have just created.

    kubectl get nodes

    Install Grafana and Prometheus

    Prometheus can be installed through the official operator or by leveraging Helm. I’ll use the Helm chart.

    Add its repository to our repository list and update it.

    helm repo add prometheus-community https://prometheus-community.github.io/helm-charts
    helm repo update

    Install the Helm chart into a namespace called monitoring, which will be created automatically.

    helm install prometheus \
      prometheus-community/kube-prometheus-stack \
      --namespace monitoring \
      --create-namespace

    The helm command will ask you to check on the status of the deployed pods.

    kubectl --namespace monitoring get pods -l "release=prometheus"

    Ensure all pods are in the “Running” state before continuing.

    Explore the Prometheus and Grafana Web UI

    By default, all the monitoring options for Prometheus will be enabled.

    Create a port forward to access the Prometheus interface.

    kubectl port-forward --namespace monitoring svc/prometheus-kube-prometheus-prometheus 9090

    Access http://localhost:9090 via your web browser and access the user interface to examine the raw metrics within Prometheus.

    The default username for Grafana is admin and the default password is prom-operator (You can change it in the Grafana UI later).

    Note: For security reasons, you should avoid exposing your Prometheus or Grafana endpoints to the public internet using a Service or Ingress.

    Since AKS operates as a managed Kubernetes service, it restricts access to internal components like the etcd store, the controller manager, the scheduler, etc. Attempting to pull metrics from these components within the cluster is not necessary. Therefore, I am disabling this option by upgrading our Prometheus release.

    helm upgrade prometheus \
      prometheus-community/kube-prometheus-stack \
      --namespace monitoring \
      --set kubeEtcd.enabled=false \
      --set kubeControllerManager.enabled=false \
      --set kubeScheduler.enabled=false

    This ensures that resources are not wasted in attempting to retrieve its metrics.

    Note: In the case of running an outdated Kubernetes version, you may need to deactivate the HTTPS metrics served from the kubelet as they are exposed over HTTP. To do this, you will need to set the kubelet.serviceMonitor.https parameter in the helm chart to false.

    helm upgrade prometheus \
      prometheus-community/kube-prometheus-stack \
      --namespace monitoring \
      --set kubeEtcd.enabled=false \
      --set kubeControllerManager.enabled=false \
      --set kubeScheduler.enabled=false \
      --set kubelet.serviceMonitor.https=false

    To clean up Azure resources and prevent further charges, execute the following command, which will delete all items within your resource group.

    az group delete --name $RESOURCE_GROUP

    Keep learning!